|
|
|

I'm using KVUE 24 News Water Usage as my source. I could not find any data on the COA site.
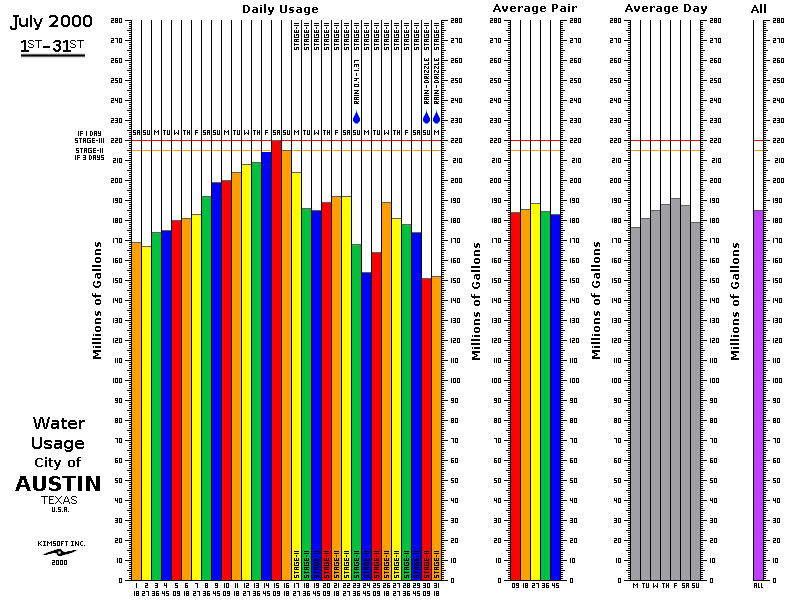
Dialog: (From the previous July, 17th Graph)
K:
Ok you zero and nine people,
using up all the water,
we know who you are,
and where you live.
D:
About those 0&9 people:
-- 0&9 day (Friday) was the last day before they announced the
ration.
The usage increased every day for more than 2 weeks before that (the
1st graph),
guaranteeing mathematically that whatever day they announce the
ration on
would have the highest cumulative total (the 2nd graph). To add
to the
bias, Fridays are historically the busiest watering day (3rd
graph). The
0&9'ers were just the lucky ones to catch the blame!
-- It will be interesting to see what the graph will do over the next few
weeks, with the ration going on!
K:
See the Animated Graph July 17-20, 2000" (108K).
L:
How big is your rainwater collection system?
K:
If you mean the collection areas, see the
Rainwater Collection Areas diagram.
The current storage capacity is about 3,000 Gallons, and it takes about one inch of rain to fill it to full from empty including the calculated loss which has been calculated by my Raincalc Software to be about 14 percent.
Austin, Texas 2001 Summer Watering Calendar
Water Sservice Rates - Retail Customeres
Wastewater Service Rates - Retail Customers
Rainwater Harvesting Program
Rain Barrel Rebate
Approved Rain Barrel Suppliers
Xeriscape Information
WaterWise Landscape Rebate
WaterWiser - Xeriscape Information (Books)
Toilet Replacement Program
WashWise Program
Austin Lawn Sprinkler Association